The following sections identify the main types of quality issues, the goals in addressing them, specific challenges encountered, and the approaches that were ultimately adopted. This is followed by suggestions for researchers who seek to effectively leverage EHR data aggregated from numerous healthcare systems.
Data missingness and reconciliation
Goal
Use the N3C database to define a cohort of interest and all relevant concepts (exposures, outcomes, confounders of interest) to evaluate the effectiveness of COVID-19 treatments.
Challenge encountered
Multi-site EHRs, even those in which the CDM has been harmonized, can display a large degree of source-specific variability in data availability. In particular, some data partners may be limited in what they can contribute due to restrictions of their source data model, differences in their extract/transform/load (ETL) processes, use of multiple non-integrated EHR platforms, or other non-technical reasons. Even in data from high-completeness sources, missingness patterns can be particularly challenging to deal with. Therefore, identifying data completeness of the prognostic factors most relevant to the study is an important first step.
Approach
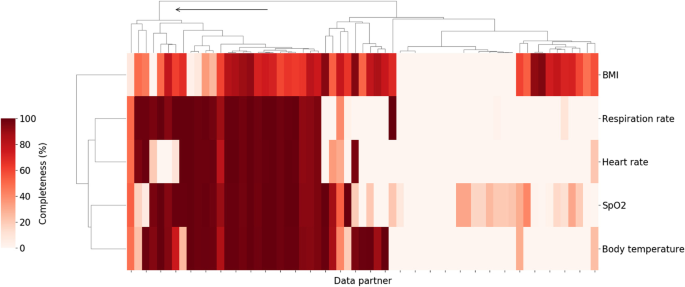
Vital signs and laboratory measurements which have previously been associated with higher clinical severity within a COVID-19 related hospital encounter [17] were chosen for data completeness analysis. Starting with vitals, data partners with high levels of data completeness for oxygen saturation measurements, respiratory rate, body temperature, heart rate, and BMI were identified. Figure 1 shows the result of hierarchical clustering of data partners based on the percentage of patients hospitalized with COVID-19 who had at least one value for those variables. Individual data partners were found to vary significantly in the extent to which they record those measurements in the study population. For example, the proportion of patients with at least one recorded value for body temperature ranged from 0 to 100% with a median of 41.4% across 67 data partners. In some cases, this may be attributed to limitations inherent to the source data model used by the data partner. In other cases, data partners with data models that do support vitals are still missing significant portions of these data. Regardless of the cause, data partners with over 70% of missing data across these key measurements were excluded. This corresponded to retaining only those data partners belonging to the first top level cluster as shown in Fig. 1.
Percent of hospitalized COVID patients with key vitals at each of the N3C data partners. Darker colors indicate a higher percentage of patients with at least one measurement for the relevant vital sign during the course of their hospitalization. Arrow indicates branch of the cluster corresponding to retained data partners (26 total). Branches of the dendrogram which are closer together represent data partners which are more similar
In addition to dropping sites with significant missing data, available metadata indicated that some data partners shifted dates prior to submission to the enclave despite being part of the HIPAA limited (LDS) data set which is expected to include non-shifted event dates. Given the dynamic nature of the pandemic, with evolving viral variants and changing standards of care, both of which may affect outcomes, only partners that did not shift their dates beyond a week were included in this study.
As a second step, the degree of capture of key variable values and the elements of critical concept sets was evaluated. A concept set is defined as the presence of one or more of a collection of diagnoses or observations, each of which define the same unified clinical concept. Since one of the unique advantages of EHR data is access to laboratory data, the discussion below is focused on clinical laboratory data, though much of it applies to demographic data and other covariates as well. Further attention was given to data and variables that were reasonably assumed to be missing not at random (MNAR) or missing at random (MAR); most ad hoc approaches for handling data using only “complete case” participants is tantamount to the very restrictive (and typically untenable) assumption that data are missing completely at random (MCAR). Therefore, it is imperative that analysts of EHR-based data make use of all individuals for a given data partner (including those with some incomplete data) and implement appropriate methods (e.g. multiple imputation, weighting) to address incomplete data capture within some individuals to better appeal to less restrictive MAR assumptions [19].
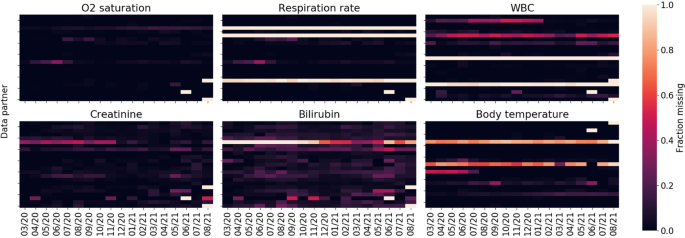
Figure 2 shows missingness of key labs and measurements among the population of hospitalized COVID-19 patients as a function of data partner and time. Temporal missingness patterns were evident, as was reporting heterogeneity among data partners. Some data partners did not appear to report certain key concepts at all. Due to the importance of these variables for establishing disease severity, data partners with (a) a proportion of missing data exceeding two standard deviations of the global proportion or (b) temporal variance exceeding two standard deviations of the global temporal variance were eliminated.
For the remaining data partners, Table 1 shows measurements for additional parameters of interest among the population of hospitalized COVID-19 patients, on a per-patient basis. Notably, substantial amounts of missingness across several measures that may be predictive of COVID-19 severity were seen. Interleukin-6 (IL-6) and oxygenation index (PaO2/FiO2) were missing in over 97% of hospitalizations and C-reactive protein and ferritin over 98% of the time; despite all four being identified as risk factors for COVID-19 related mortality [20]. This is not unsurprising as they are not collected routinely in the context of standard of care, and in fact are more likely to be collected or recorded for individuals in critical condition. However, data were also frequently missing for several parameters that would be expected to be available for patients hospitalized with COVID-19. These data underscore the difference between EHR data and data sets populated with results systematically collected in the context of prospective clinical trials and epidemiologic cohorts (study contexts with more clearly delineated best practice for accommodating missing values; for example, see the National Research Council panel report on clinical trials, https://pubmed.ncbi.nlm.nih.gov/24983040/ or the PCORI Methodology Committee standards).
Following this close examination of data missingness by data partner, 15 out of 67 sites (43,462 out of 307,193 patients) remained in our analysis. While retaining only 22% of data partners significantly reduces the sample size, the strict criteria ensured a more internally valid population, avoiding potential biases related to missing values’ impact on downstream analyses.
Takeaway / suggestions for researchers
When working with a large heterogeneous dataset that integrates data from many individual health systems, it is prudent to consider which hospital systems or data partners are appropriate for the analysis at hand, with their respective extent of data missingness as a key consideration. For each specific research question, it will be important to think critically about what will be important to measure, to evaluate how these variables and concepts are reported across data partners, and potentially exclude partners that do not meet these question-specific criteria.
Drug exposure
Drug code sets
Goal
Evaluate the use of therapeutic medications administered to hospitalized COVID-19 patients.
Challenge encountered
A significant amount of variability was found in drug exposure data due to flexibility in the data model specification. Depending on how the drug was coded, dosage information may or may not be available. If an active ingredient was coded at the ingredient level, dose and route of administration information were frequently missing with strength entirely missing. Continuing with the working example of remdesivir, Table 2 shows the distribution of drug concept names for the descendants of the RxNorm ingredient class code remdesivir. The vast majority (88.5%) are coded at the ingredient level with no available route of administration nor dosage available. This is not particularly problematic for the route of administration since remdesivir is only administered intravenously and has a well-defined dosage, though duration of therapy might vary in clinical practice.
These challenges, however, were more of an issue when looking at other drug exposures, such as dexamethasone, which can be administered in a variety of dosages, routes, and strengths (Table 3).
Approach
Given that remdesivir has a well-defined dosage, treatment was able to be defined broadly without relying on any dosage data. Adjustments for dexamethasone treatment in the analysis of outcomes among patients treated with remdesivir were based on binary indicators of whether dexamethasone was administered at any dose. This was considered sufficient for questions focused on the effectiveness of remdesivir. Studies where an understanding of dexamethasone dosage is important may need to take further measures such as performing a sensitivity analysis, as the clinical effects of dexamethasone can vary significantly based on dose, duration and route of administration.
Takeaways / suggestions for researchers
Due to inconsistent reporting in drug exposure data, it may be difficult to characterize drug dosing. Depending on the research question being asked, it is possible to be more or less sensitive using the available drug metadata at the expense of selectivity. For example, using the ingredient code and all descendants will be highly sensitive, but will not be specific to an individual dose, strength, or route. If dosing is important, it may be necessary to conduct a study only among data partners that reliably report dosage. When data on dose or route are missing, it is further essential to carefully consider other clinical factors such as bioavailability and/or the extent to which the standard dose has been agreed upon in clinical practice.
Duration of drug exposure
Goal
Understanding the duration of patient exposure to a particular treatment.
Challenge encountered
Within the OMOP data model, a “drug era” is defined as a continuous interval of time over which a patient was exposed to a particular drug. OMOP defines its own derived drug era table based on drug exposures, but relies on certain rules which may not be suitable for all situations. For example, two separate drug exposures separated by a gap of 30 days or less are merged into a single era. This persistence window may be suitable under some circumstances, such as for outpatient exposures to chronic medications, but it is inappropriate for short-term inpatient acute care. Consequently, manually generating drug eras is often required. When doing so, it is important to consider the variability in the drug exposure records found in N3C.
How drug exposure data are presented and some of the issues to consider for remdesivir are illustrated below. Table 4 shows the first common drug exposure scenario encountered, where there are duplicate rows each day representing the same exposure for a particular patient. The exact reason for the duplication can vary; in some cases one row may represent the drug order and the other the administration. This scenario is typically characterized by the presence of a single bounded one-day interval and secondary unbounded interval sharing the same start date. In the scenario below, the total number of exposure days is 5, which is typical for a remdesivir course. Table 5 presents an alternative scenario where drug exposures are combined into contiguous multi-day intervals. It is also the case that some entries may be erroneous, indicating an exposure start date after the end date; those entries should be discarded. In the example below, we see that ignoring the unrealistic entry still yields a 5-day course, but that is not always the case.
The two examples presented are not representative of all possible scenarios encountered in N3C, but they show the two most common documentation paradigms: in some cases exposures were single day with or without end dates, and in other cases drug exposures were in fact presented as multi-day intervals. The main task was dealing with duplicate values, unrealistic start and end dates, other data quality issues, and consolidating contiguous intervals into drug eras.
Our approach
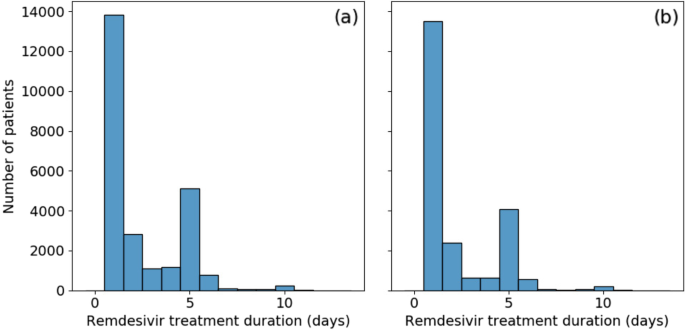
Data were reviewed closely (findings described briefly above), and custom programmatic data cleaning was implemented for every scenario encountered. Remaining open intervals were treated as single day exposures. Consolidating drug exposures did not alleviate all drug era data quality concerns. Figure 3a shows the distribution of remdesivir treatment duration. Over half [55%] of patients appear to have received only a single day of treatment. This is unusual as remdesivir has a very specific recommended course of either 5 or 10 days. There is a secondary large peak at the 5 day mark and a minor additional peak at 10 days. To evaluate the possibility that those treatment courses were terminated early due to mortality or discharge, instances where the final day of treatment coincided with either of those two events were removed. This did not significantly affect the results, as shown in Fig. 3b, with no treatment duration proportion changing by more than 5%.
Further investigation into the drug exposure metadata reveals that over 80% of single-day exposures report “Inferred from claim” for drug type concept name. The metadata for the remaining entries recorded “EHR”, many of which were duplicates, or were empty. These may be the result of incorrectly tagged billing records, but do indicate treatments that were not directly logged into the EHR. The split across data partners was not even; a single data partner was responsible for 73% of the single-day records, with the remaining are split across an additional 10 partners; other data partners did not record single day exposures. Another possibility is that some proportion of these single day exposures are the result of early treatment termination due to adverse drug reactions. However, this was considered unlikely due to the connection with the “inferred from claim” concept name. It is always possible to drop the offending data partners at the expense of statistical power; in this instance, however, the data partner with the largest number of single-day exposures contained 36% of all remdesivir treated patients in our population.
Takeaways / suggestions for researchers
The inability to properly resolve treatment durations severely limits the use of methods such as time-dependent Cox regression or marginal structural models for the study of time-varying effects of treatments or exposures. Consultation with clinical experts was also found to be critical to understand realistic use patterns of the medication under study and identify irregular treatment duration reporting. Given the inconsistencies in the data and necessary assumptions to process these data, researchers should consider conducting sensitivity analyses using different assumptions to understand the impact of assumptions on results.
As a final note regarding drug exposures, this discussion has focused on the situation where drug dosing, route of administration, and medication reconciliation were not important. If that information is critical to a particular study, then the drug exposure data require further processing and refinement. This is beyond the scope of this work, but a separate contribution is being prepared where drug exposures are discussed in greater detail.
Baseline medical history
Goal
Assess patient characteristics among remdesivir-treated and non-treated patients and adjust for relevant confounders based on patient histories by summarizing comorbidities identified during a baseline period prior to hospital admission.
Challenge encountered
While EHRs can be a rich source of clinical information that is collected prospectively at the time of health care delivery, they often do not contain medical information related to encounters or treatments occurring outside of the contributing healthcare system or prior to an initial encounter. This has been described previously by Lin et al. as EHR-discontinuity [21]. While information exchanges do exist, such as Epic CareEverywhere or Health Information Exchange, there are no guarantees on availability of such records for research purposes. If hospitalized patients typically receive primary health care services from a health system other than that of the admitting hospital, then any prior treatments, medications, immunizations, diagnoses, etc. may not be reflected in the EHR from the system where the COVID hospitalization occurred. Because the patients’ records from other health systems are not included, it may falsely appear that these patients do not have comorbidities or prior treatments. This can result in the misclassification of risk scores such as the Charlson Comorbidity Index [22]. This is distinctly different from continuity issues arising due to lack of care access or patients who avoid seeing medical care. Regardless, comorbidities, prior treatments, or other covariates commonly used for adjustment in observational research are often presumed to be absent if no records are present. This is particularly problematic for studies in acute or critical care settings where admitted patients may have received routine care prior to their admission at an unaffiliated healthcare practice for conditions that may affect outcomes.
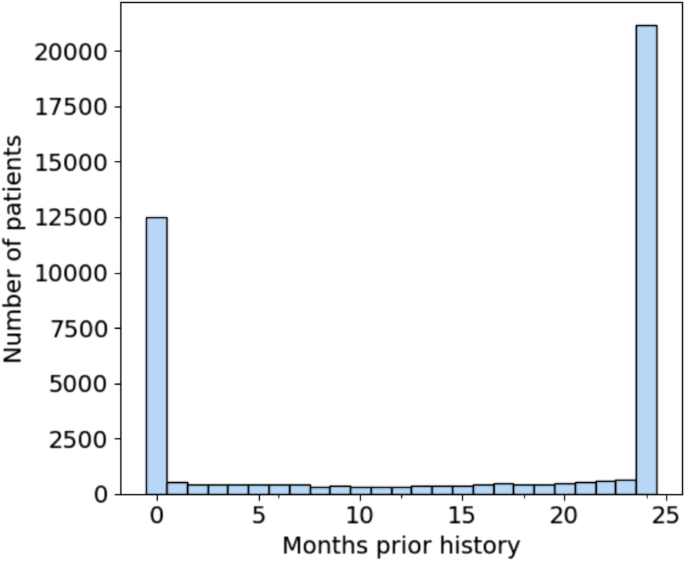
The significance of EHR-discontinuity in N3C was evaluated by first looking at the availability of prior history among the hospitalized patient population. Prior history was defined as the number of months between a patient’s earliest recorded visit of any kind and first COVID-related admission, which would represent the study setting for evaluation of remdesivir effectiveness. Figure 4 shows the resulting distribution of months of prior history in the patient population. There are 12,523 patients, representing nearly 30% of the total population, which have no record of visitation prior to their hospitalization. Of those patients (22.5%) with at least 1 prior visit, the duration of history is approximately uniformly distributed up to 23 months, with a substantial fraction (49%) having ≥24 months (maximum possible in N3C).
Distribution of months of prior history for first-time COVID 19-related hospitalized patients. Nearly 30% of patients have no recorded visits prior to their admission. Note that N3C patient history lookback was limited to records no older than 1/1/2018. Therefore, all patients with 24 months of history or greater were grouped together
The characteristics of patients with no history, 1-23 months of history, and 24 months or greater history are shown in Table 6. There is a statistically significant difference in every characteristic between the three groups. Patients with maximum available history are older (median age, 65 [IQR, 52-77] years vs 60 [IQR, 43-73] and 59 [IQR, 45-71] years of age for 1-23 months and no history, respectively) and are more likely to have documented comorbidities. They are more likely to have recorded medication use for cardiovascular disease (i.e. ACE inhibitors, ARBs, and statins) and are also more likely to be female (11,190 [53%] vs 4894 [50%] and 4862 [39%]). The gender imbalance is consistent with the observation that females are more likely to seek out medical care than males [23].
Despite being a significantly younger group and appearing to have lower prevalence of known risk-factors for severe COVID-19 [24, 25], both ventilation on admission (2361 [19%] vs 894 [9.1%] and 1852 [8.8%] for 1-23 and 24+ months respectively) and in-hospital mortality among patients with no history is higher (1785 [14%] vs 1058 [11%] and 2390 [11%] for 1-23 and 24+ months respectively). These patients may represent a heterogeneous mixture of individuals who were previously healthy (truly without comorbidities), patients who received routine care elsewhere (comorbidities present, but data are missing due to healthcare fragmentation), and patients with unmet medical need (comorbidities present but not documented in any health system due to poor access to healthcare). Researchers will need to be aware of potential information bias in estimated treatment effects among hospitalized patients that may be present if differences in EHR continuity are not properly accounted for in analyses.
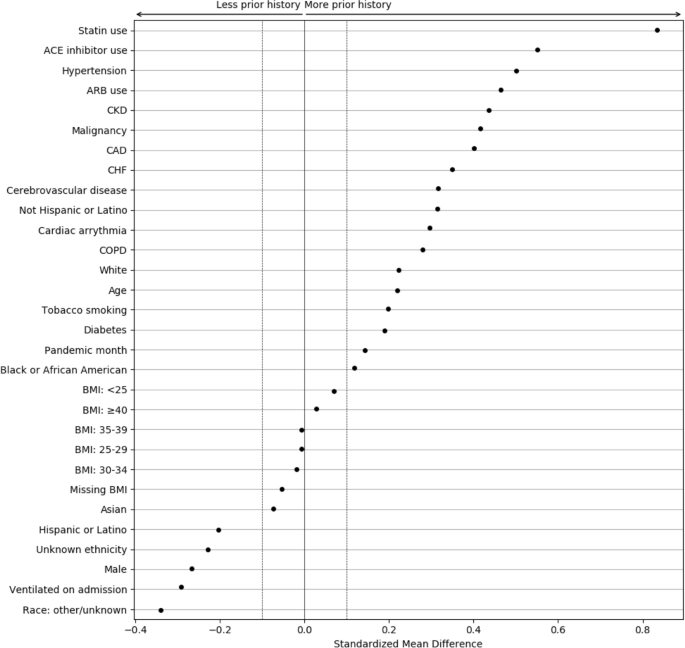
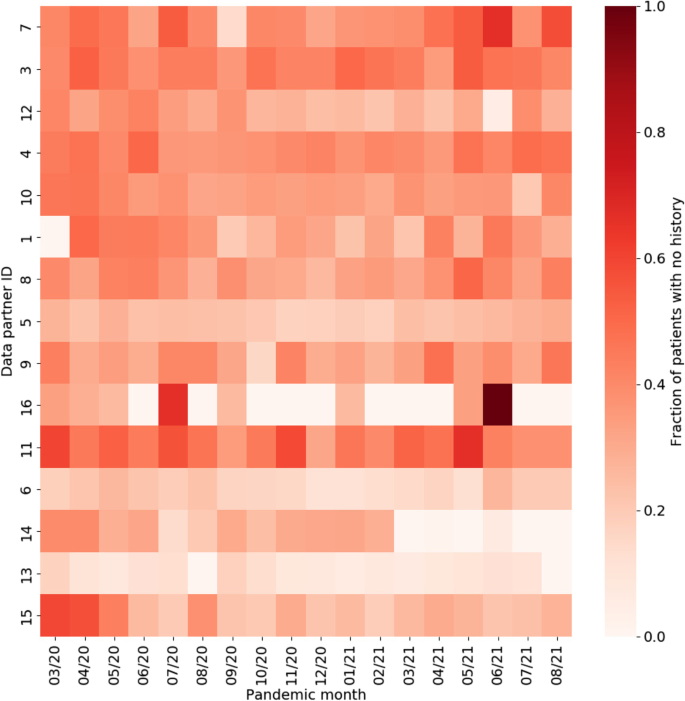
To better understand the magnitude of the differences associated with EHR continuity, the standardized mean differences (SMDs) were calculated between patients with and without any prior history, with magnitude less than 0.1 indicating negligible difference between groups (Fig. 5) [26, 27]. Chronic conditions and related treatments display the greatest differences since they are most likely recorded in a primary care context. We additionally examined potential temporal or location effects. Figure 6 shows the relationship between pandemic timing, data partner ID, and history of missingness in more detail. This is an important step to help identify if there are any specific patterns in prior history missingness that may need to be handled separately. For example, data partners 13 and 6 have a lower level of missingness than others throughout the pandemic while data partner 16 displays a highly irregular pattern of no missingness on most months and a high degree of missingness on others (7/20 and 6/21). These temporal patterns may be the result of upgrades or changes to EHR systems that occurred during the pandemic, the addition or removal of clinics or hospitals in a particular health system, or a potential change in record keeping practices during peak times in the pandemic when healthcare systems were stressed.
Standardized mean differences between patient characteristics, pandemic timing, and data partner ID, for patients with and without prior history. The largest differences are observed for chronic conditions and their treatments. Missing demographic information such as race and ethnicity also display large differences
Approach
Due to EHR discontinuity, it can be challenging to classify traditional baseline health comorbidities in the population of interest. However, in N3C, the availability of laboratory measures from the index COVID-19 hospitalization can be leveraged, relying more heavily on these proximal clinical measures to characterize illness severity and prognosis. When estimating treatment effects, one valuable strategy that does not require an additional modeling is to perform a sensitivity analysis to understand the impact of EHR-continuity on the estimand. The general protocol for performing this analysis would be as follows: first, an initial analysis would be performed including only those patients whose EHR-continuity can be established. Then, the influence of EHR-discontinuity would be assessed by sequentially introducing groups with less prior history; in the N3C, the data include two additional groups, 1-23 months of prior history, and no prior history. As noted previously with the differences in on-admission ventilation and in-hospital mortality, the groups may not reflect the same patient population. If sample size allows, calculating effect estimates separately within groups could also be informative to evaluate the presence of effect measure modification over patient history, or whether treatment effects vary by severity.
Takeaways / suggestions for researchers
EHR discontinuity poses a challenge in the use of multi-institution EHR data, limiting the ability to control for confounding by baseline comorbidities. However, severity of illness upon hospitalization is likely one of the most important confounders in studies of COVID-19 treatment. The N3C data do have the unique advantage of having laboratory results and other measurements from the index admission, although, as noted in Table 1, these data may be missing from certain sites. These detailed clinical data measured at index admission can be used as more proximal measures to account for differences in severity of illness across patients, and may be more relevant than many chronic comorbidities that are more difficult to measure [17]. When using the a multi-site EHR database, researchers will need to consider the specific research question at hand, what baseline confounders will be important to measure, and how much history is needed to reliably measure confounders of interest. If proximal variables that are readily available are not sufficient and baseline conditions are necessary to account for, researchers may consider requiring a history (or density) of visits within the database and can refer to prior work that described these strategies in detail [21].
Clinical outcomes
The effect of remdesivir on in-hospital death, mechanical ventilation, and acute inpatient events were the focus of this work which are all key outcomes of interest in COVID-19 research.
Mortality
Goal
Understanding the risk of mortality among patients hospitalized with COVID-19.
Challenge encountered
Patient death data in N3C is primarily obtained from the EHR. Incorporating external mortality data through privacy preserving record linkage (PPRL) has begun. Until this process is complete, only deaths that occur during hospitalizations are guaranteed to be captured. Patient deaths that occur after a patient is discharged home or to another facility are not guaranteed to be captured, resulting in an underestimation of overall mortality. Any outcome involving death can only characterize in-hospital mortality. There are rare circumstances where patients’ families report death to a data partner after patient discharge which may be recorded. In those situations, the recorded death date falls outside of the visit date range.
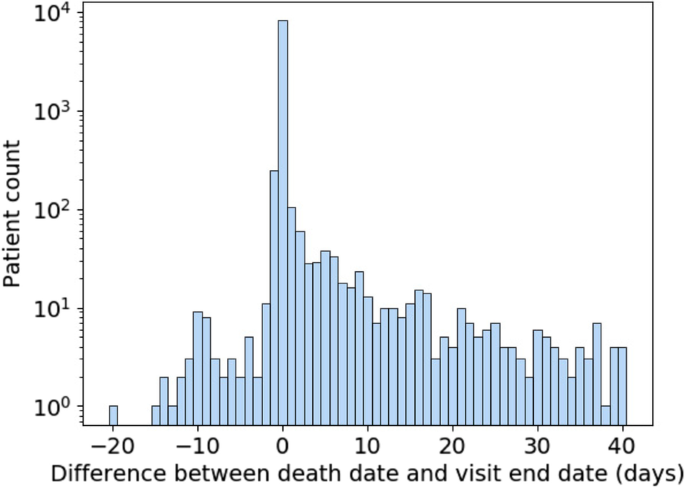
Data quality is another important consideration when using mortality data in N3C. Figure 7 shows the difference in days between recorded death dates and visit end dates for patients in the selected population who have died. Deaths were excluded for patients who had any record of subsequent visits, which can arise due to billing artifacts. A difference of zero represents deaths that were recorded on the same day as the end of the visit and constitute the majority of deaths. Because timestamps are not always available for visit end and death dates, we limit ourselves to day-level resolution. Depending on the time of day, a small difference in when a death was recorded and when a visit was ended can result in them occurring on different days. As a result, deaths recorded a day before or a day after the visit end date are to be expected. Therefore, it may be justifiable to consider deaths occurring a day after a visit end date as in-hospital deaths.
This leaves both deaths that occur two or more days prior to or after the visit end date. As for the former, they are extremely rare, numbering in the single digits. They can be excluded as part of data quality checking and may be the result of data entry or other sources of error. Deaths which are reported days after a visit end date and are not directly connected to a recorded visit are more numerous. This asymmetry suggests that it is unlikely that the same mechanism is behind both early and late death dates. It may be that some data partners are receiving additional data on deaths which occur outside of their facilities following hospitalization. However, since there are no specific guidelines or requirements for out-of-hospital mortality reporting within N3C, it cannot be relied on for analysis. Therefore, it is best to treat those patients as not having experienced in-hospital mortality for that visit because this supplementary death data was not systematically available.
Approach
Due to the inability to reliably study deaths that occur out-of-hospital, the outcome was carefully defined for this analysis as inpatient death within 28 days. Patients who died more than a day before discharge were dropped, and mortality for patients who died greater than 1 day past their visit end date was not considered.
Takeaways/suggestions for researchers
Researchers should be familiar with the limitations in studying mortality in multi-site EHR repositories. Unless complete linkage to external mortality data is present, the data only reliably capture deaths that occur during hospitalization. Any studies reporting risks of mortality using these data will need to be explicit in how mortality is defined, and consider the implications of studying only in-hospital mortality. To assess the impact of this limitation on estimates of risk, researchers can consider conducting sensitivity analyses, comparing mortality risk estimates when patients are censored at a fixed follow-up duration. Alternatively, discharge can be directly treated as a competing risk using competing risk methods such as the Fine-Gray subdistribution hazard model or cumulative incidence functions [28,29,30]. Within N3C, post-discharge mortality data has recently become available through PPRL which largely addresses this issue. However, it still remains a common problem in EHR-based research where external linkage may not be available.
Acute inpatient events
Goal
Understanding how to distinguish acute events related to complications of initial cause of hospitalization from adverse events of treatment.
Challenge encountered
Common acute events occurring during hospitalization range from DVT/PE, myocardial infarction (MI), stroke, pulmonary edema, and allergic reactions to common infections such as bacterial pneumonia, urinary tract infection (UTI), or sepsis. Identifying such acute events accurately from EHR data can be challenging for a few reasons. First, ensuring that these events have acute onset and do not represent previous medical history carried forward into the visit requires detailed record checking. While OMOP does provide a field for supplying condition status (eg. “Primary diagnosis”, “Secondary diagnosis”, “Final diagnosis (discharge)”, “Active”, “Resolved”, etc.…), it is rarely populated in N3C and thus not suitable for analysis. Second, parsing out diagnoses occurring as a response to treatment versus those that are the reason for receiving a treatment is complicated by the absence of sufficiently high temporal resolution and detailed clinical information which is typically buried in unstructured EHR data. Third, suspected or differential diagnoses can potentially be misclassified when identifying an acute event by diagnosis codes.
Approach
First, the presence of the outcome prior to hospitalization is checked. Due to variability in EHR entry, some data partners record previous medical history daily during a patient’s visit, which eliminates the ability to differentiate between a new or recurring event. For example, a patient with a previous medical history of MI may have this diagnosis in their medical record. For each day during the patient’s hospitalization, their medical history is carried forward and displays a diagnosis of MI. However, this does not represent the patient having a new MI on a daily basis. Such scenarios can be identified by calculating the number of events recorded per day throughout the visit. If the event of interest occurs at least daily, these patients cannot be considered to have experienced that acute event.
Timing of the outcome is also important. When assessing the safety and effectiveness of a treatment, confirming that the acute event occurred as a response to treatment is required. Although identifying cause and effect is challenging, steps can be taken to mitigate errors. Once patients who were identified to have had a previous medical history of an event were excluded, it was ensured that the event occurred after the treatment of interest. More generally, appropriate time windows should be considered based on anticipated effects of the drug or procedure. Any patients who have an outcome prior to treatment should be excluded.
Takeaways/suggestions for researchers
Researchers will require detailed assessment of acute event outcomes to ensure they do not represent prior events carried forward. Additional data can be helpful to ensure accurate detection of acute events. Confirming events with lab results when available can further increase confidence in detecting the outcome. For example, MI diagnosis with corresponding elevated troponin can improve specificity of capture. Events without explicit lab findings can be supported with related procedures. The level of sensitivity vs specificity is dependent on the study objectives and can be further assessed through a sensitivity analysis.
Composite outcomes
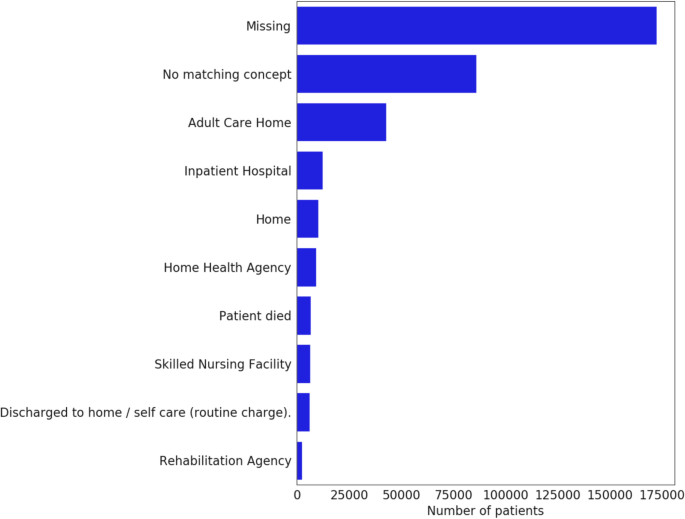
Composite outcomes, such as in-hospital death or discharge to hospice, incorporate information from the discharge disposition. Unfortunately, discharge disposition reporting is very rare, with some CDMs lacking support altogether (Fig. 8). Therefore, they are best avoided, or, if strictly necessary, should be limited to data partners who undergo consistency and completion checks.
https://news.google.com/rss/articles/CBMiT2h0dHBzOi8vYm1jbWVkcmVzbWV0aG9kb2wuYmlvbWVkY2VudHJhbC5jb20vYXJ0aWNsZXMvMTAuMTE4Ni9zMTI4NzQtMDIzLTAxODM5LTLSAQA?oc=5
2023-02-17 10:50:22Z
1786460127
Bagikan Berita Ini


0 Response to "Data quality considerations for evaluating COVID-19 treatments using real world data: learnings from the National COVID Cohort Collaborative (N3C) - BMC Medical Research Methodology - BMC Medical Research Methodology"
Post a Comment